
Evaluating an Accessible In-Vehicle Interface
Accessibility / Usability / Mixed Methods
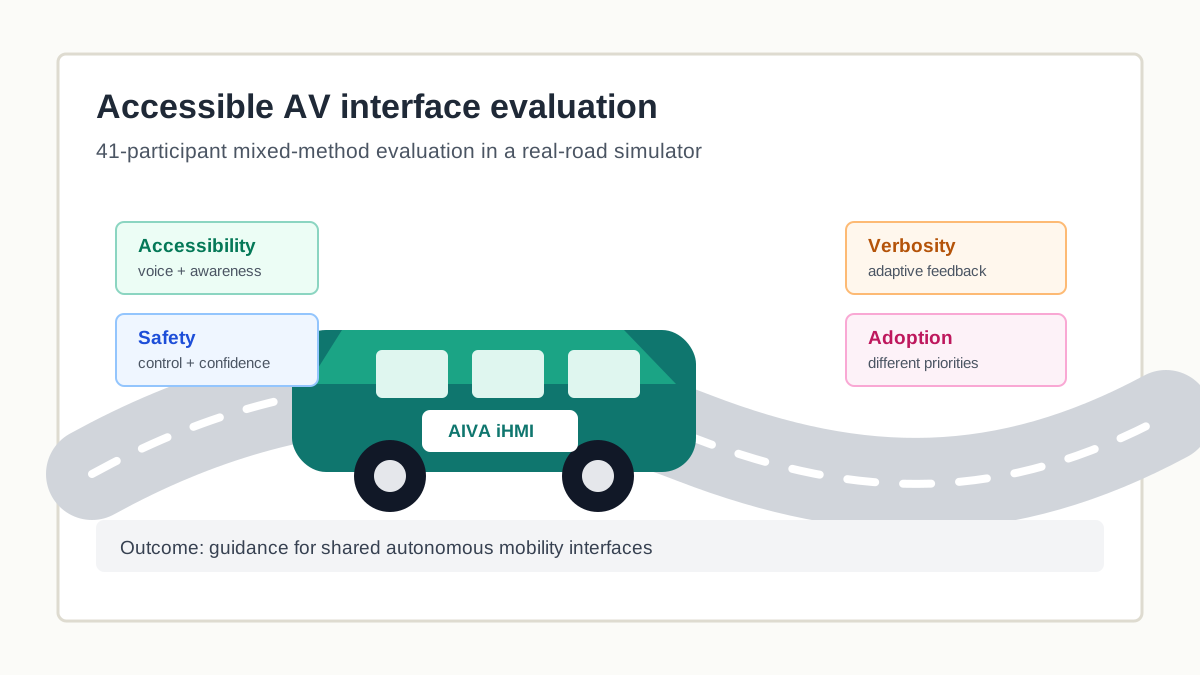
I led a mixed-methods study of an in-vehicle interface to learn how the same design works for people with and without disabilities.
Project Objective
Autonomous vehicles could expand mobility for people with disabilities, but inclusive design is not just about adding accessibility features. A feature that is essential for one group can become distracting or unnecessary for another. For shared autonomous vehicles, that tension matters because the same in-vehicle interface may serve riders with very different abilities, expectations, and risk perceptions.
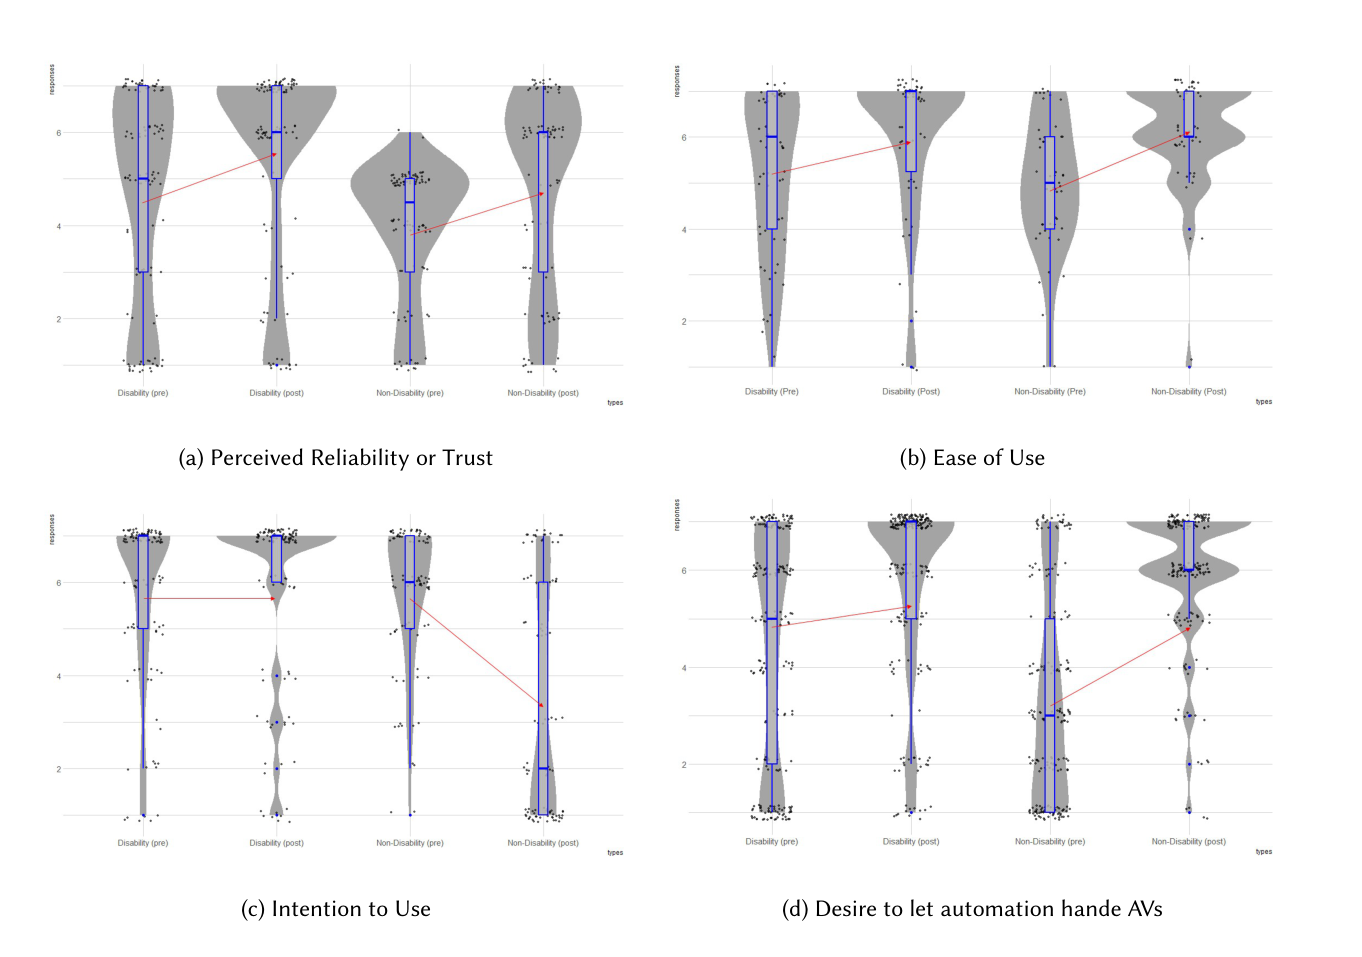
The project asked whether accessible iHMI features change acceptance factors such as perceived safety, reliability, ease of use, control, and intention to use autonomous vehicles.
Project Approach
Timeline
* Human-subjects IRB approval extended the calendar timeline; once approval was in place, remote setup, data collection across three U.S. locations, and analysis moved quickly.
Tools
Prototype
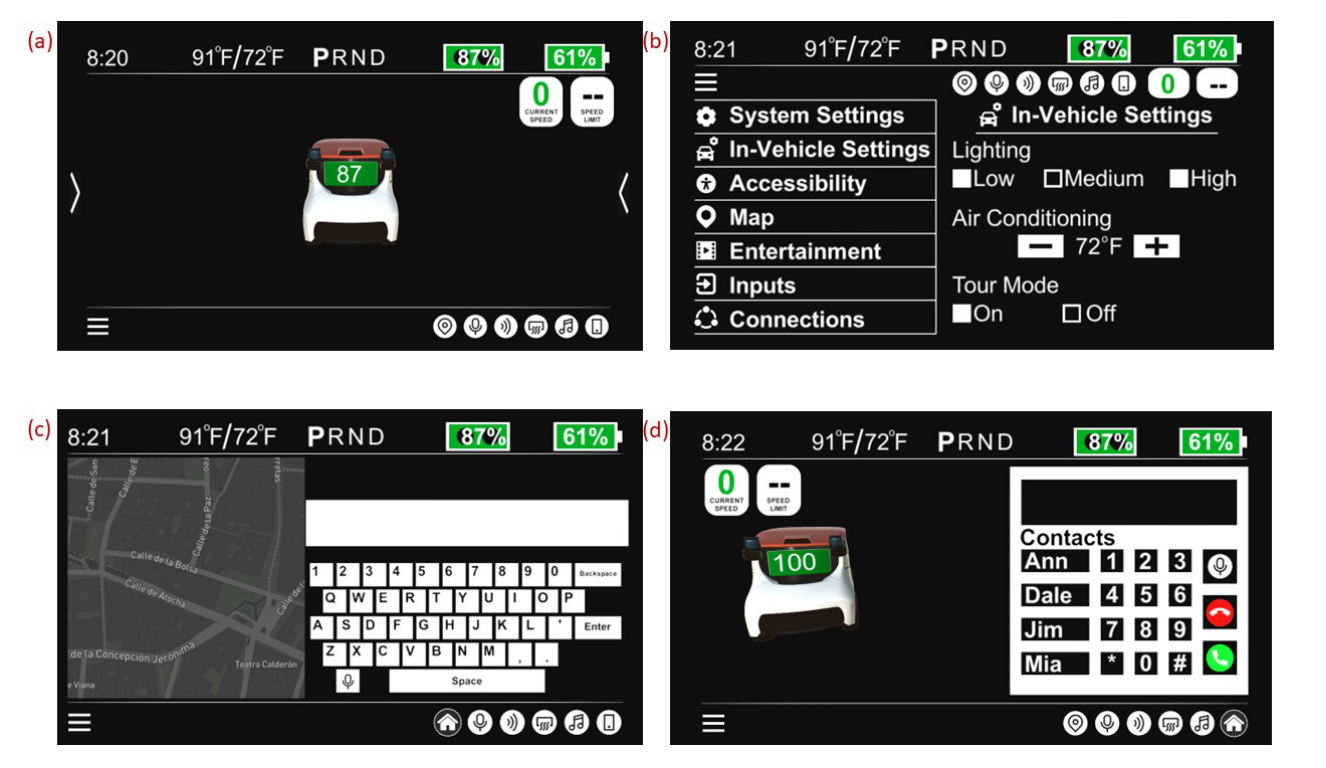
Developed the iHMI prototype in TypeScript and used Llama 2 for AI-enabled interaction support.
Quantitative workflow
Used Qualtrics for structured measures and R for scale scoring, group comparisons, and statistical analysis.
Qualitative workflow
Used Otter.ai for transcription support and MAXQDA for interview coding and thematic analysis.
Field coordination
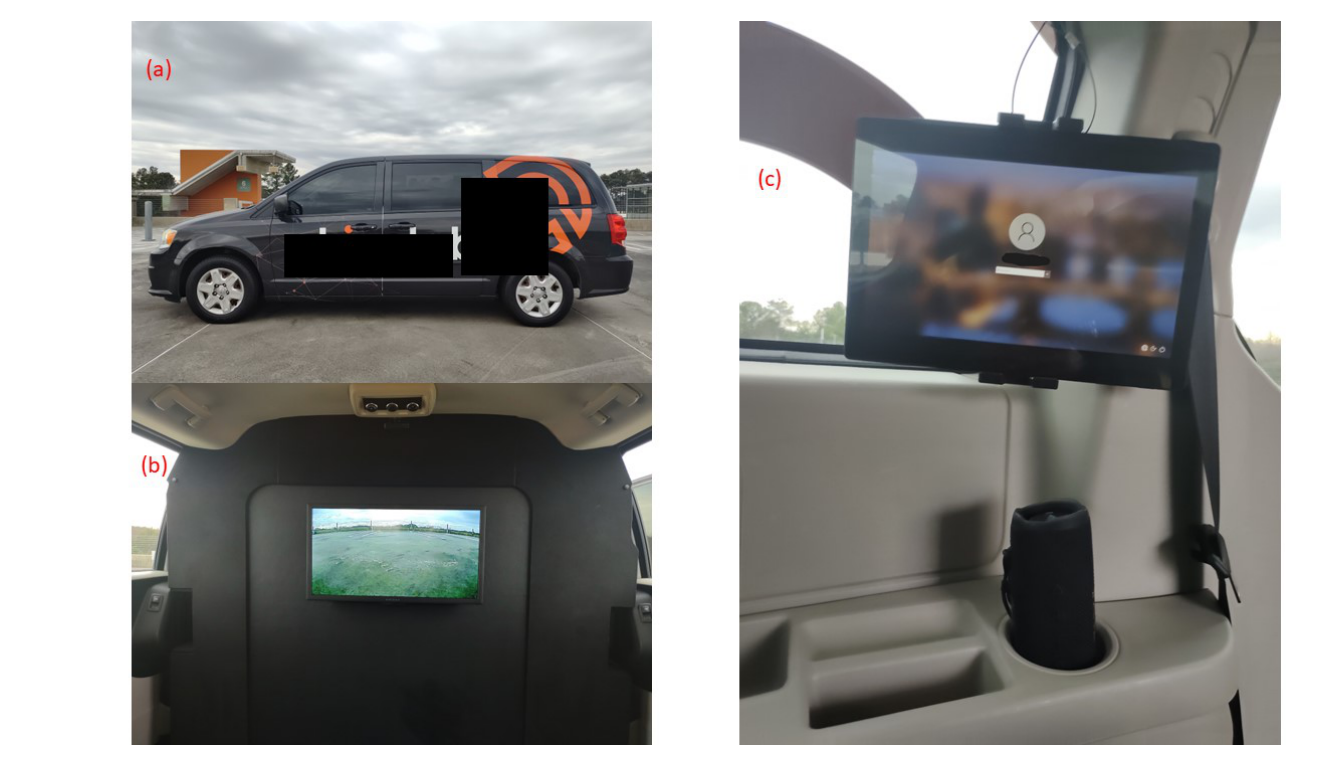
Coordinated the RRADS vehicle setup, tablet interface, speaker setup, and participant sessions across locations.
Method Alternatives and Choice
Alternative: Survey-only approach
A survey could compare attitudes toward autonomous vehicles, but it would not show how safety, control, voice feedback, and information load changed after an embodied ride experience.
Alternative: Desktop or VR simulation
Desktop and VR methods provide more experimental control, but they reduce the real-world cues that matter in vehicle trust: intersections, pedestrians, traffic, motion, stops, turns, and the feeling of being a passenger.
Alternative: Closed-course test
A closed course would improve safety and consistency, but it would remove everyday route complexity and would have been harder to run with remote disability-advocacy partners.
Chosen: RRADS mixed-method evaluation
The Real Road Autonomous Driving Simulator balanced ecological validity and safety. Pairing pre/post scales with interviews let me quantify acceptance shifts and explain why participants with and without disabilities reacted differently.
Project Artifacts
Quantitative Signal
Representative Data
"I felt safe because it was giving us warnings about upcoming safety signal lights."
D8, on situational-awareness feedback
"I liked the fact that I had control; if I wanted to go somewhere, I could give the command."
D10, on independence and control
"It gives you a lot of information and a little bit of time."
D2, on information overload
"The vehicle didn't move until there was absolutely no oncoming traffic."
N2, on cautious behavior and perceived safety
Key Insights
Safety meant different things to different riders.
Participants with disabilities often valued situational awareness and independence. Participants without disabilities focused more on cautious driving behavior at intersections, lane changes, and pedestrian scenarios.
Essential accessibility feedback could become overload without controls.
Time, route, and surroundings information helped riders with visual impairments orient themselves, but some riders without disabilities saw repeated auditory updates as redundant.
Voice interaction increased access, but responsiveness and pacing shaped confidence.
Most participants liked voice control. Desired improvements included better recognition, slower pacing when needed, interruptibility, and options for voice style or pitch.
For some users AVs are independence infrastructure; for others they are convenience technology.
This difference explains why the same interface feature can feel necessary, optional, or distracting depending on the user's mobility context.
Design Recommendations
Make verbosity adaptive
Let users control how much information is spoken, and make the system learn route familiarity, context, and user preference over time.
Separate safety-critical alerts from ambient awareness
Keep essential safety updates prominent while allowing optional landmark, route, and status details to be reduced or paused.
Design for shared vehicle realities
Profiles can help personal vehicles, but shared AVs need adaptive settings that work when riders have mixed abilities and preferences.
Treat control as a trust feature
Provide clear destination confirmation, emergency options, voice fallback, and recovery paths when commands are not recognized.
Outcomes
Broader relevance: The findings also apply to shared devices and services that use voice, audio feedback, personalization, and safety alerts.